Earlier this year Money Inc came out with an article where they listed 10 stocks to consider trading that they considered to be undervalued. Here is the article:
https://moneyinc.com/undervalued-stocks-to-consider-in-2019/
They provided a little reasoning and a little bit of fundamental analysis as to why you should consider buying these stocks in 2019. It isn’t anything too in-depth and is a super easy read.
What I am going to do is go over these 10 stocks using the technical analysis setups I personally use to trade to see if these are in fact good trades. I’ll provide the setups that my system has discovered. Some will be long setups and others will be short setups. I’ll also provide a video covering all 10 of the stocks I go over in this post that you can find below the 10 stocks I go over here.
For the way I trade I am selling at the extremes. The setups presented will not be a trend-following system because those types of trades do not work for me.
When I am looking to go long I am looking for a retracement in a stock and when I am looking to go short I am looking for an extreme move up. I don’t really short stocks too much but I do short futures, Forex, and cryptos. I just do not like to short stocks for some reason. It doesn’t fit the way I like to trade.
Growth stocks and undervalued stocks are ones I look for in my stock portfolio so this article caught my eye. I do try to look at the fundamentals because I learned the hard way that in trading stocks you cannot just go by the technical analysis.
Here is an article I wrote that goes in detail about what I look for and how I scan for stocks to trade using fundamentals: https://evancarthey.com/how-to-scan-for-winning-stocks/
The online screen I use is free and is called Finviz. They have a paid option but I’ve never used the paid version before. The free version has worked just fine for what I need.
The technical analysis I will use to go over these 10 undervalued stocks will be primarily my 78.6% setup and the 823.6% setup. There might be a Spring Board Trade Setup as well but the first two are the main ones I have been using with great success.
The 10 stocks in the article are:
- Southwest Airlines (LUV)
- Sony (SNE)
- Eaton Corp (ETN)
- Gilead Sciences (GILD)
- Signet Jewelers (SIG)
- Celestics (CLS)
- Fiat Chrysler Automobiles (FCAU)
- Tyson Foods (TSN)
- Prudential Financial (PRU)
- Principal Financial Group (PFG)
All of the technical analysis I provide with the setups will provide precise entries and exits. There will not be any “what if” scenarios. If I provide a trade setup then I guarantee you that I will provide precise entries and exits. No hedging allowed here!
The 10 Undervalued Stocks to Review
Southwest Airlines (LUV)
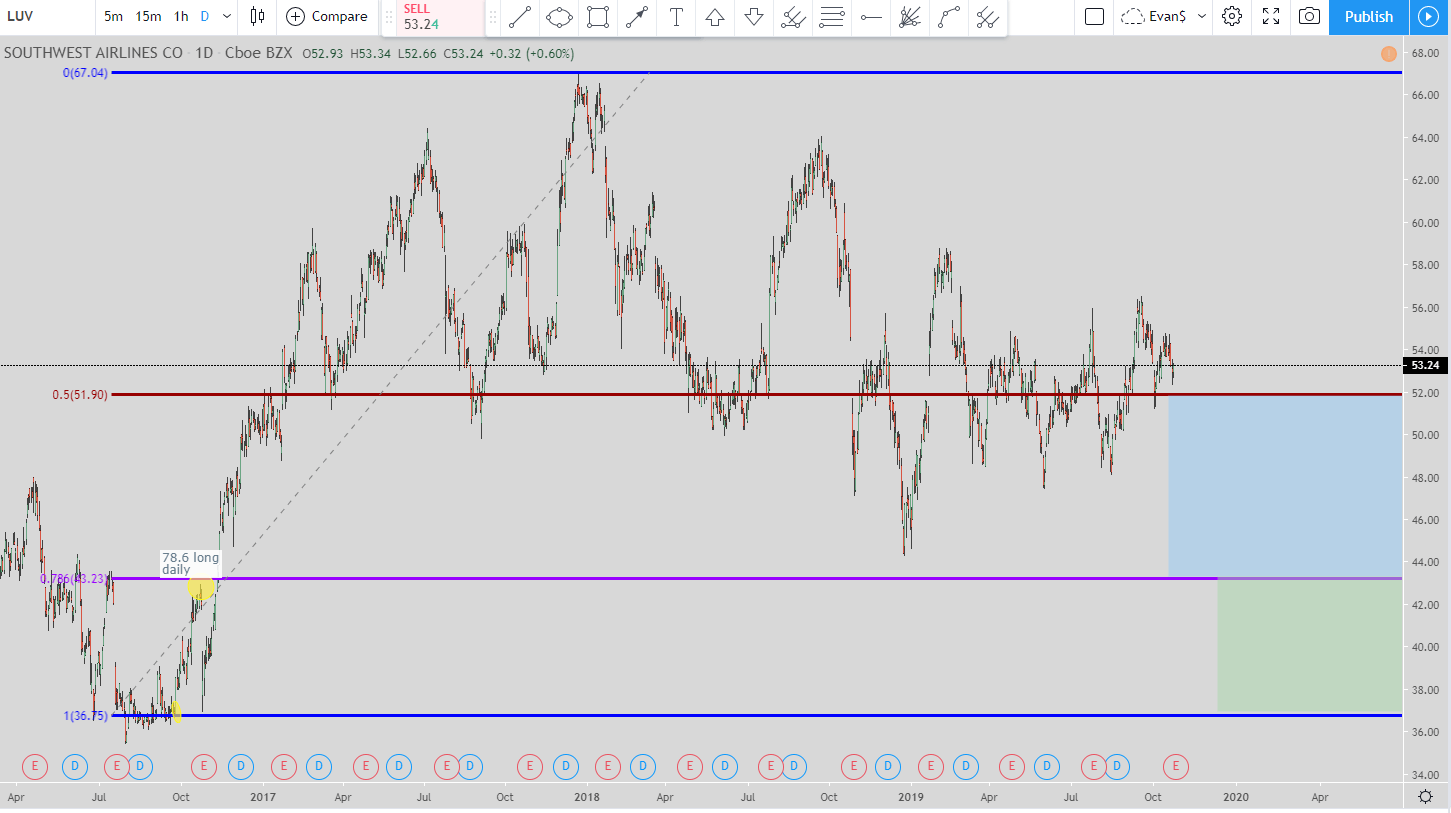
For Southwest Airlines being the 1st on the list for the 10 undervalued stocks we are waiting on a long setup. The setup being used is the 78.6% long.
As long as the pivot high holds way up at $67.04 then this setup remains valid.
The 1st entry will be at the 78.6% line at around $43.23. Once that is hit then the exit will be the 50% line at around $51.90. But if the price continues to go down without hitting the 50% line but hits the 100% line at $36.75 then the exit moves to just below the 78.6% line at around $43.20. I always have my exits slightly off the hard exit but I am listing the hard exits here because once those get hit then the move is over.
After that the exit will not move lower anymore. Even if the price continues to move lower the exit won’t move again.
So with Southwest Airlines (LUV) we are waiting for a retracement to occur before we think about entering into the stock.
Sony (SNE)
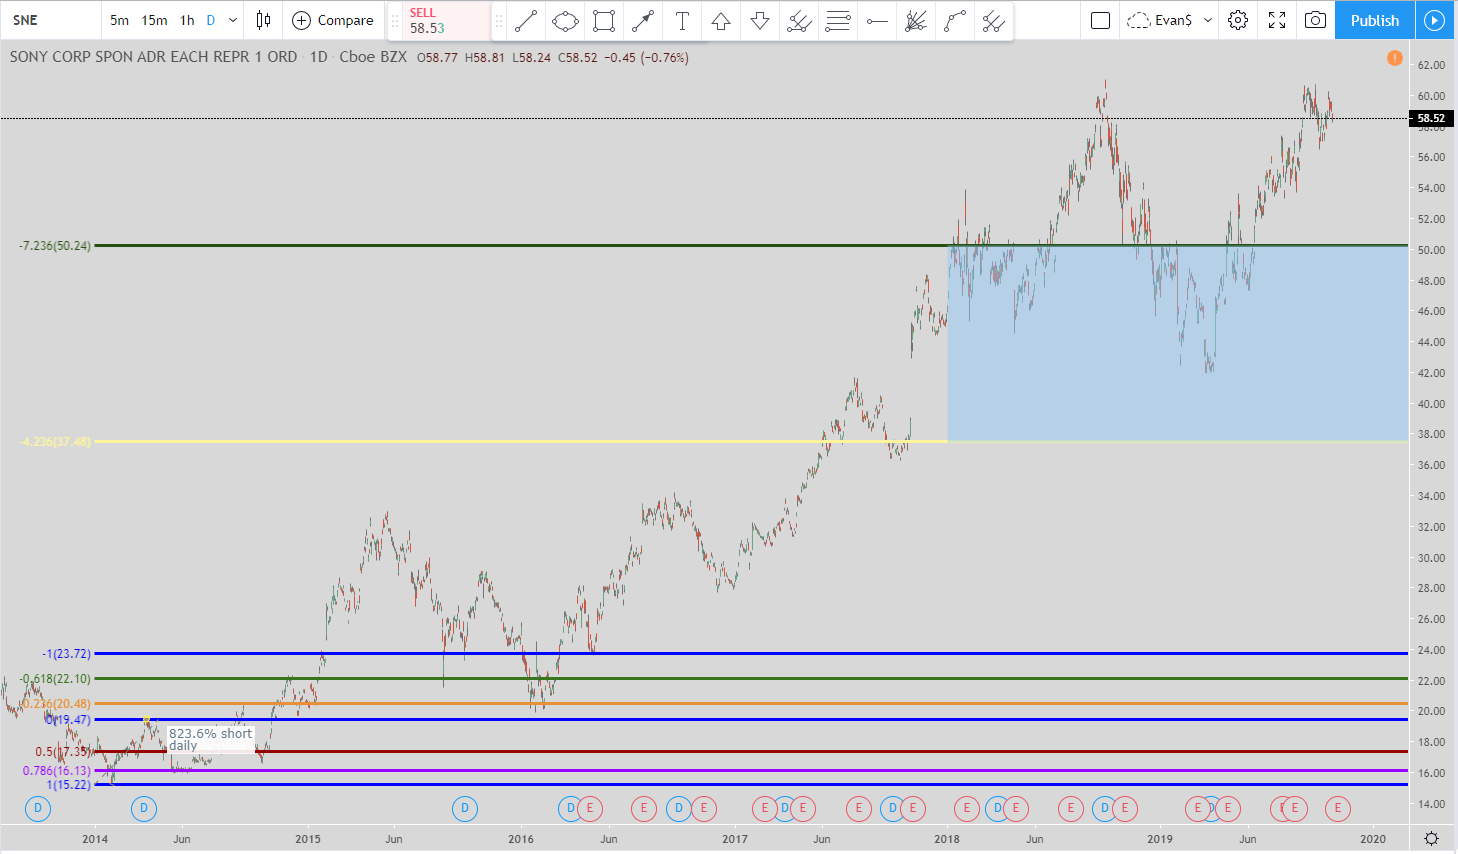
The next up is Sony (SNE). We are using the daily time-frame for this setup and it is a live setup. The setup being used is the 823.6% short setup. The entry was at the -7.126% level on the chart which is the 823.6% Fibonacci extension level.
The exit is the bottom of the blue box around $37.50.
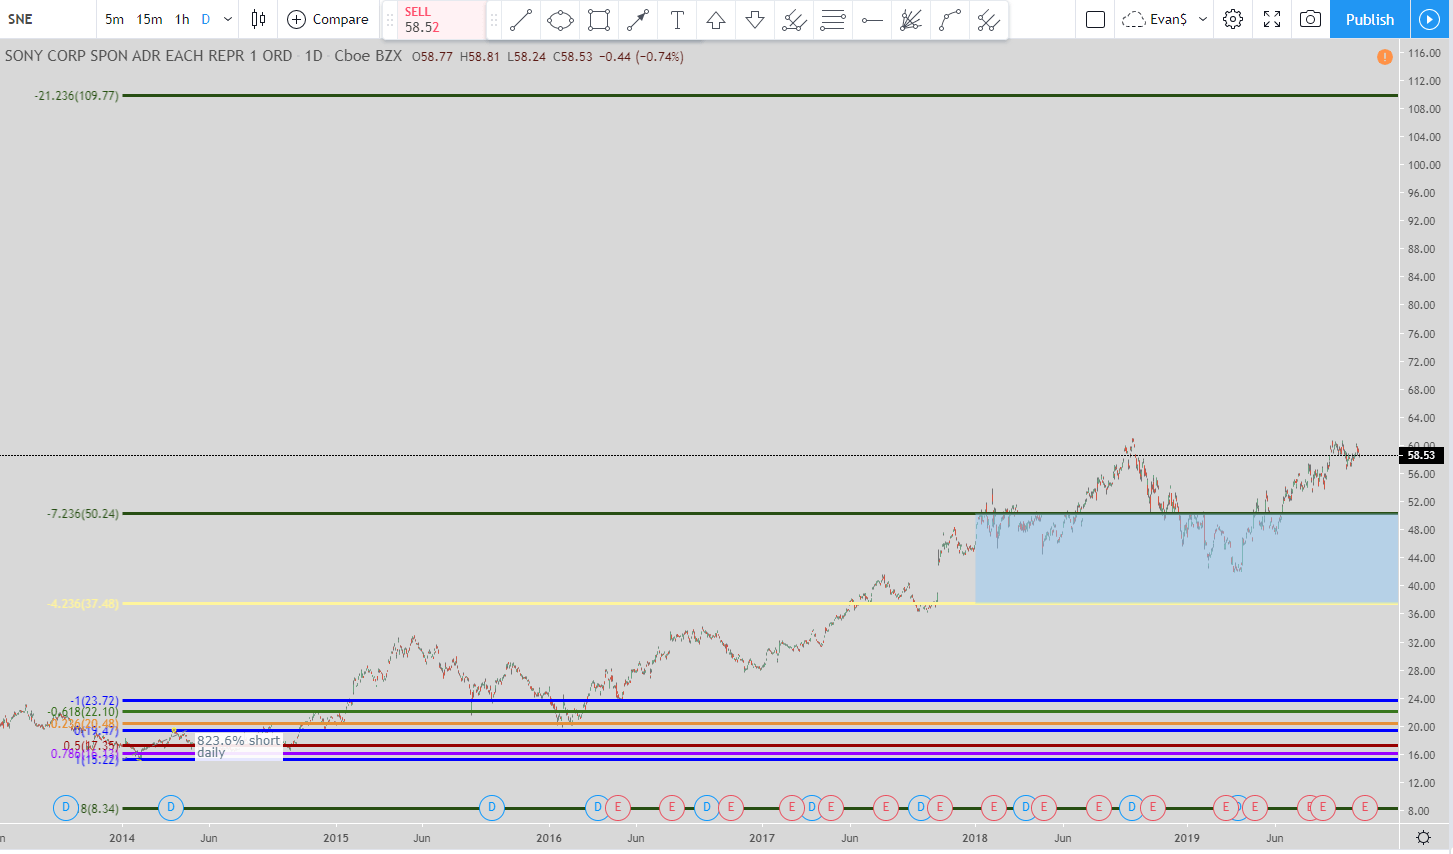
But if the price keeps going up without hitting the exit and hits the -21.236% line which is the 2,223.6% Fibonacci extension line then you would go short there as well and your exit would be the -7.236% line at around $50.24. Again, I always get out just before the hard exit to ensure I get filled.
To be honest, I hate shorting stocks. I rarely ever do it. But I wanted to present shorts as well as longs in this article because I know plenty of people short stocks.
Eaton Corp (ETN)
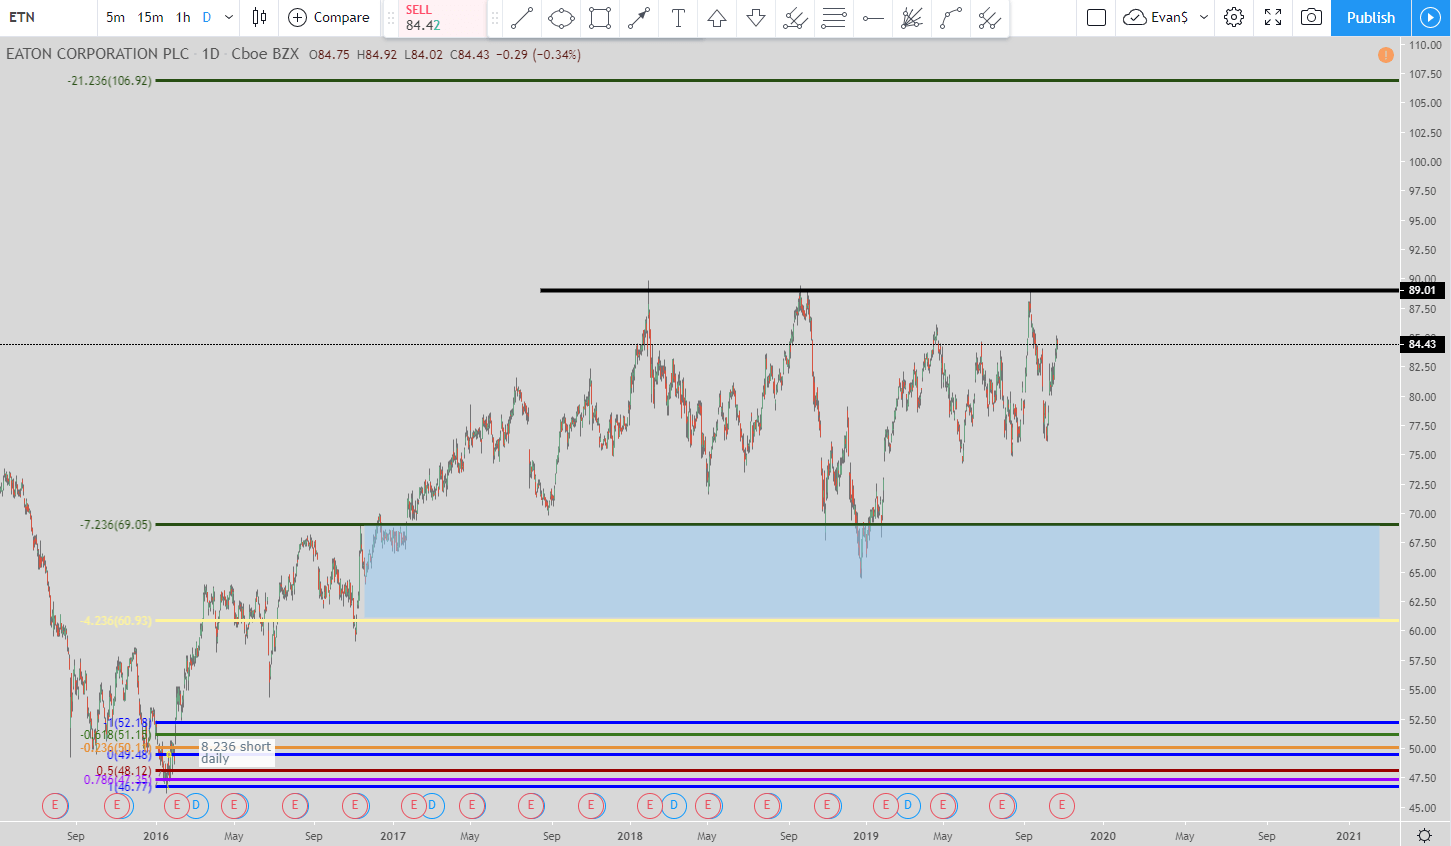
With Eaton’s stock (ETN) we are using the daily time-frame and the setup is the 823.6% short. Before I go into the entries and exits I wanted to point out the black line I drew.
Eaton’s stock has created the resistance level where the black line is located. It is something to be aware of as the price creeps back up to the $89 level.
This is a live trade where the first entry was the -7.236% level at $69.05. The current exit is the bottom of the blue box around $61.00.
But if the price keeps on going up without hitting the exit but hits the -21.236 (2,123.6% Fibonacci extension level) line at $106.92 then the exit would move to just north of the -7.236% line at around $69.05.
Gilead Sciences (GILD)
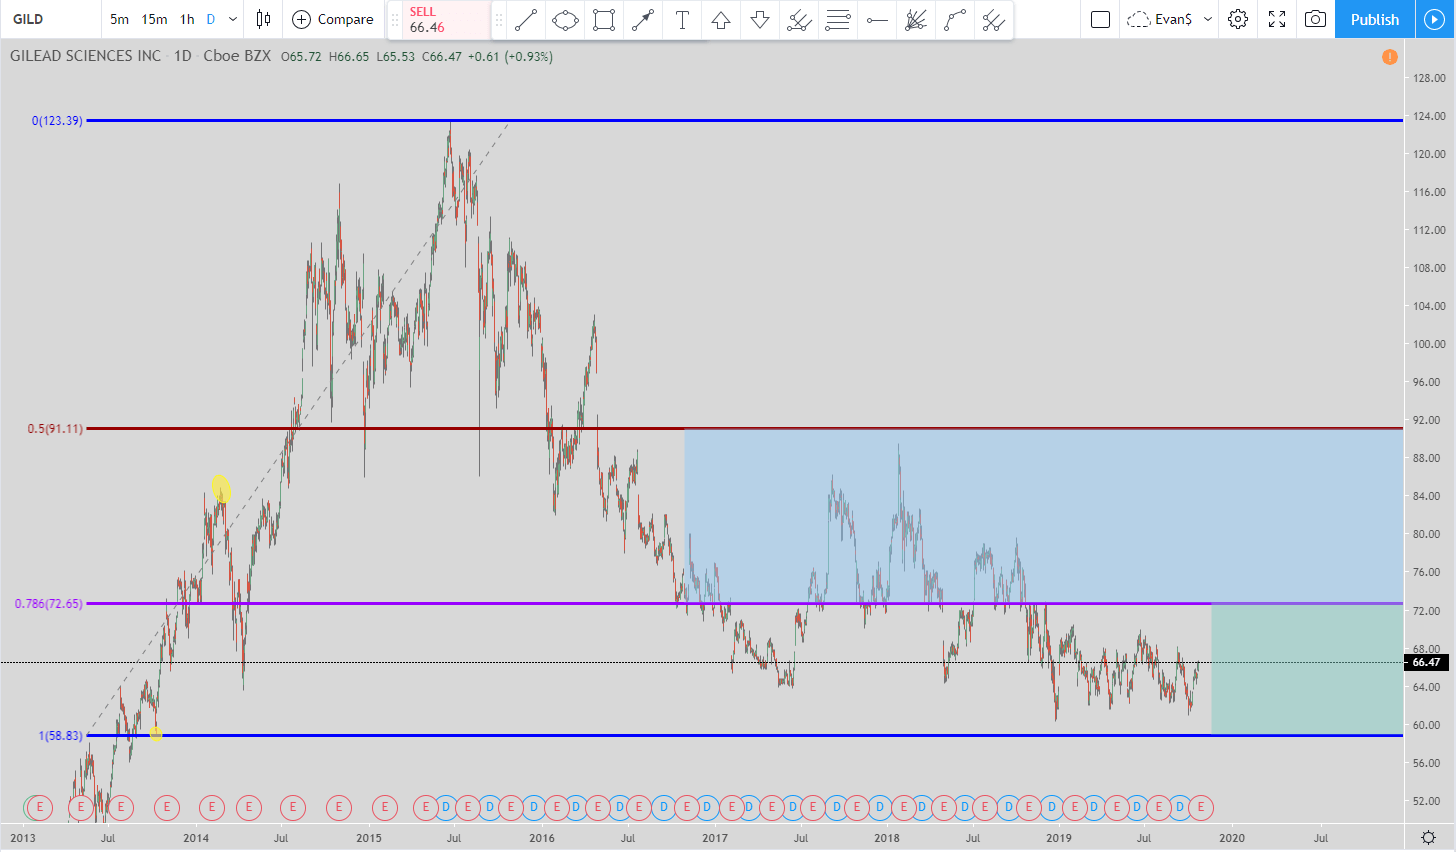
For Gilead Sciences (GILD) we are looking at a 78.6% long using the daily time-frame for the chart. This is another trade that is currently live.
The trade initiated when the price hit the 78.6% line at $72.65. The exit is currently the top of the blue box which is the 50% retracement level at $91.11.
But as you can see the price has continued to move down. So if the price hits the 100% line at $58.83 then the exit will move to the 78.6% line at $72.65.
That will be the last time the exit moves. So even if the price continues to move lower than $58.83 the exit won’t move again. It will just get you in at a lower price if you continue to scale into the stock.
With the worst exit being around $72.65 and the current price at $66.58 (at the time of this writing) then this is what I call a “free trade.” That means if you get in at any-time under $72.65 then your final exit will be in profit. I’ll try to go over what I am talking about in the video so hopefully it makes sense.
Signet Jewelers (SIG)
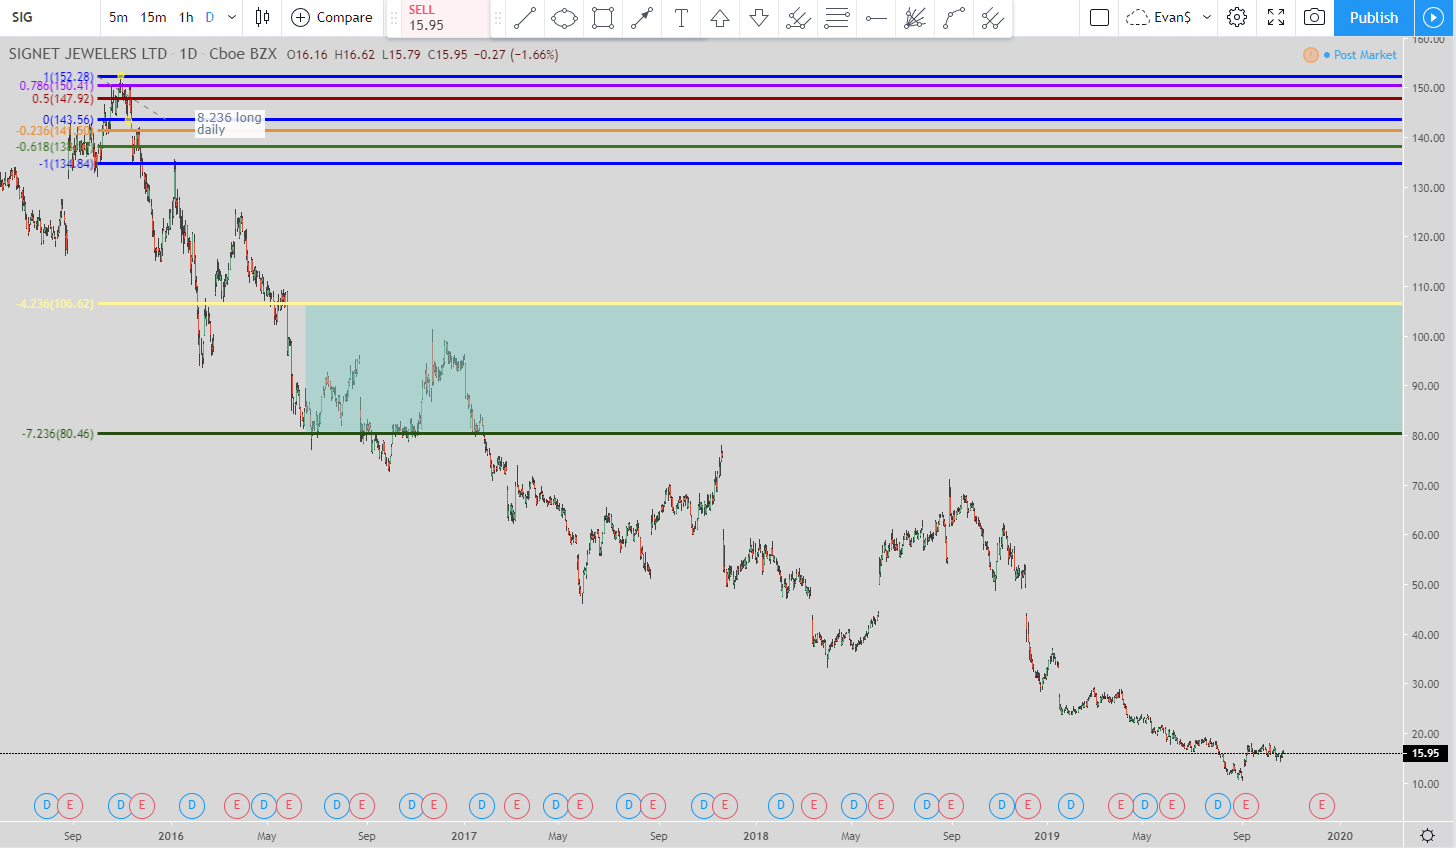
If you believe in Signet Jewelers then this is the stock to buy. The setup I am using is the 8.236% long. The setup initiated when the price hit $80.46 which is the -7.236% line.
With this setup this is the only entry because the next entry is in the negative territory since that is where the -21.236% Fibonacci extension level falls.
So if you are looking for a stock that has a setup saying that the current exit is at around $106 then this is the one for you. The price is currently around $15.95.
When a stock makes a move this big down it does cause me to pause because I’ve been burned plenty of times trying to look for a huge rebound.
The exit is the top of the green box around $106. If this stock doesn’t go bankrupt and turns it around then it could be a huge win. But as I just mentioned, I am vary wary of a stock that has this big of a move down.
5 More Stocks to Go
Celestica (CLS)
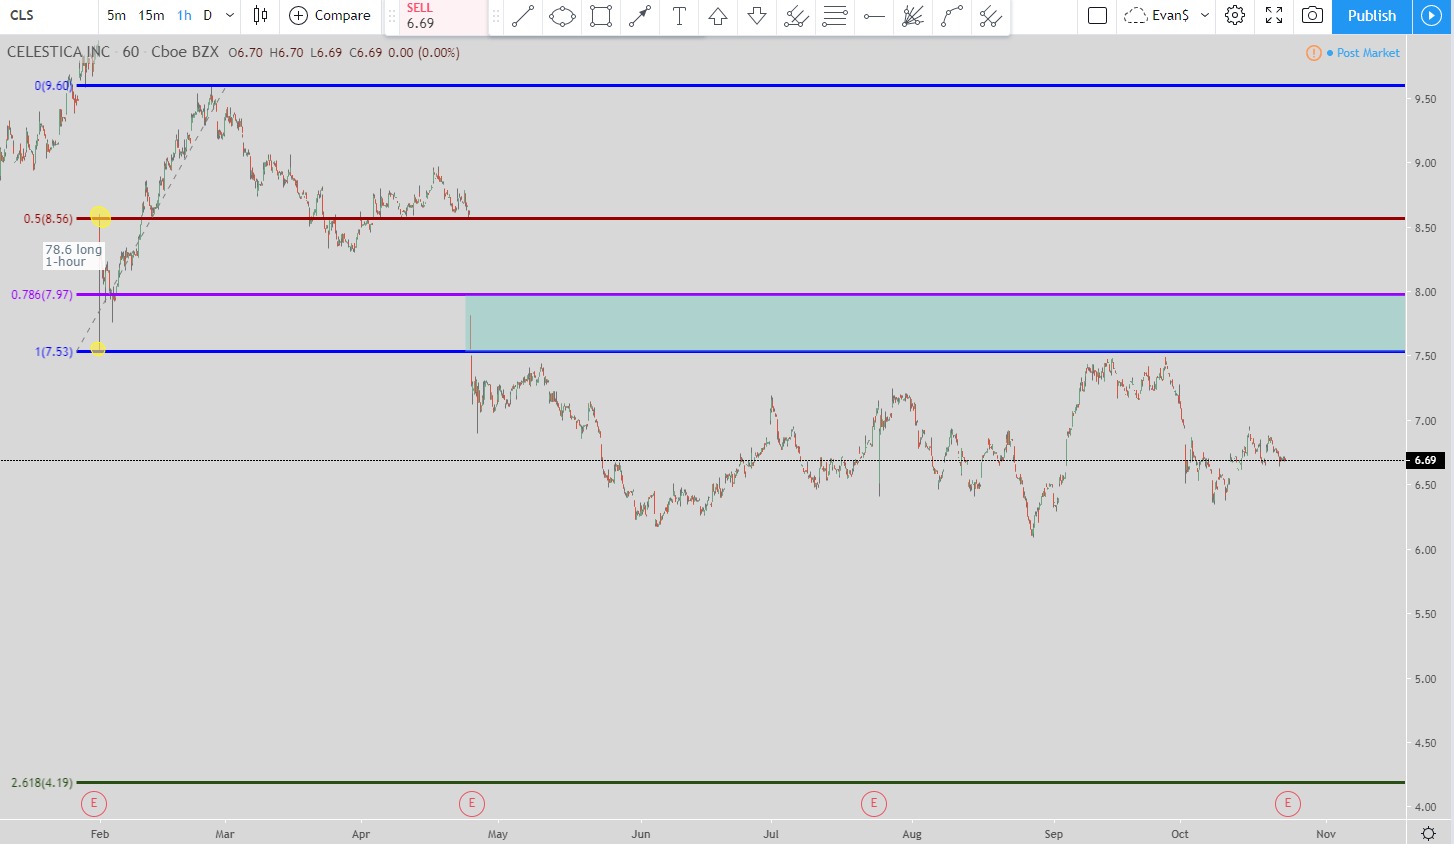
With CLS we are using the 78.6% long setup in the 1-hour chart.
When the price hit the 78.6% line that started the trade. But as you can see the price blew right through that and the 100% line. When price hit the 100% line then that moved the exit.
So the current exit is the top of the green box at the purple line (78.6%) at $7.97. The exit could move one more time to the blue line at $7.53 but that only happens if the price of CLS’s stock goes down to the 261.8% Fibonacci extension level at $4.19. If it does that then you would move your exit and that would be the last time it moves.
But if the exit goes up and hits the 78.6% line at $7.97 first then the move is over and we go and look for another setup. You do not look to get in at the 261.8% Fibonacci extension line.
This stock is offering a good return since at worst, the final exit could be around $7.50 but that only happens if the price goes down and hits $4.19. The current exit is at $7.97.
Fiat Chrysler Automobiles (FCAU)
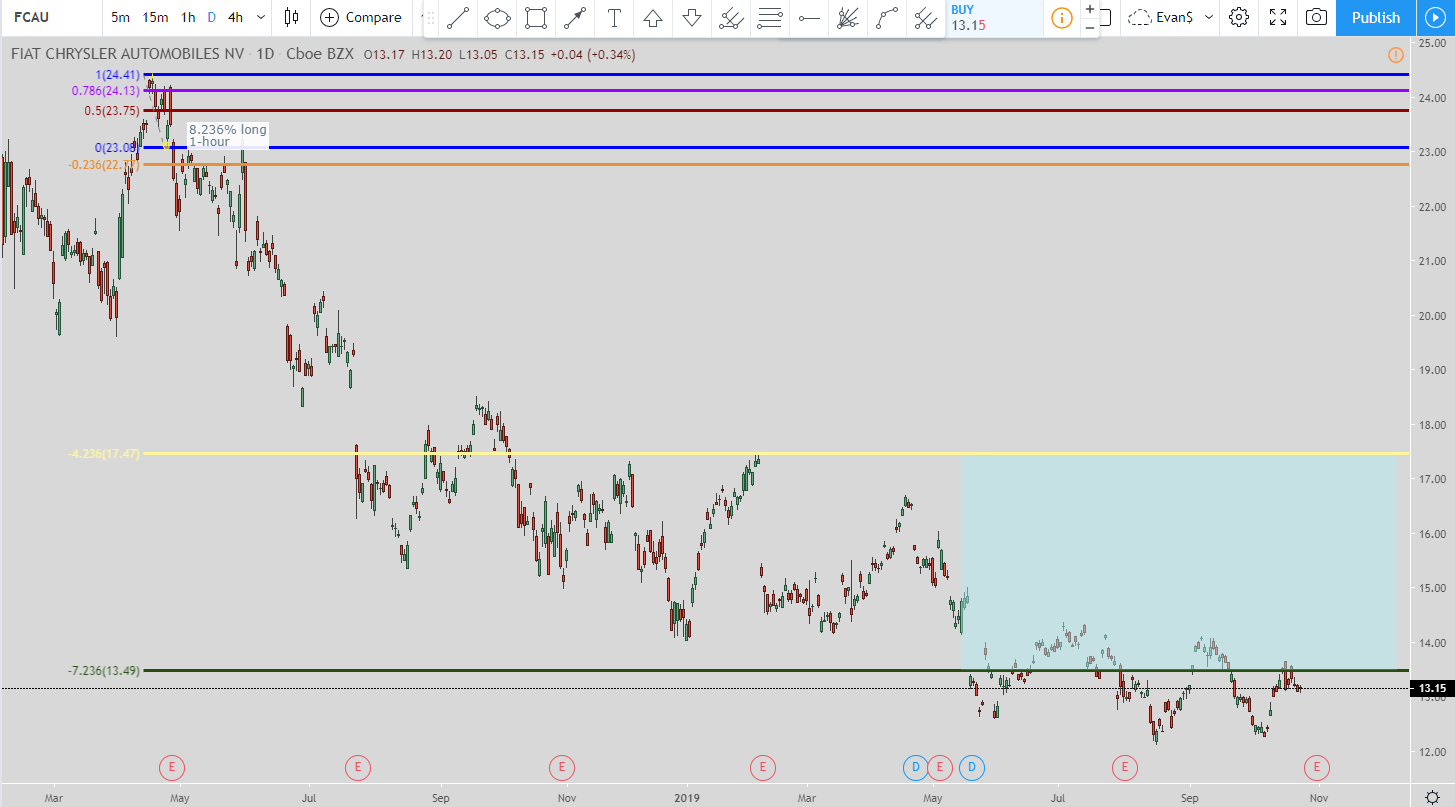
With Fiat Chrysler Automobiles stock we are looking at an 823.6% long setup from the 1-hour time frame chart. The picture above is using the daily time frame in order for everything to fit into the picture and not be too squished.
FCAU has obviously been in a downtrend for the last year and a half. If you believe they will make a comeback then this setup is very intriguing. The entry was when price hit the green line at $13.59. The exit is at the top of the blue box around $17.45. From here the exit will not move again. This is the final exit.
Even if the price continues to move lower the exit will not move. I’m not looking at buying this stock at this time but if I was then what I would do is open a small position at these levels ($13.16) and continue to add to it if the stock price continues its move lower.
I have no idea where the bottom is with this stock so when I look at trades this way I gradually scale into it.
Tyson Foods (TSN)
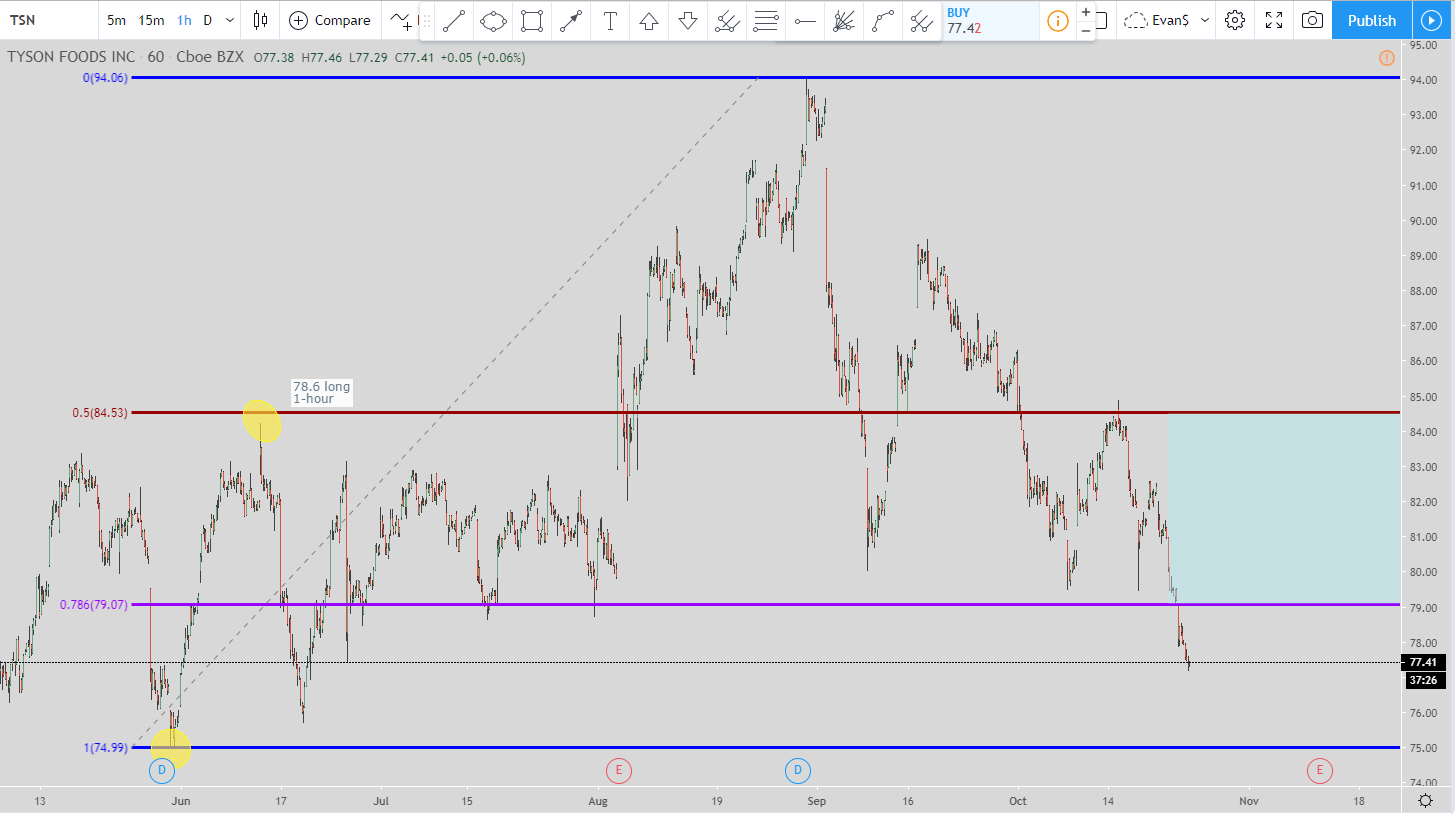
For Tyson Food’s stock they are in a 78.6% long setup using the 1-hour time frame. When the price hit the 78.6% Fibonacci line at $79.07 that initiated the trade. The current exit is the 50% line which is the top of the blue box at $84.53.
But if the price continues to move lower without hitting the exit then there are two more possible entries. The next entry would be the 100% line at $74.99 (the blue line). If that is hit before the price hits the 50% line then the exit would move to the 78.6% line (the purple line) at $79.07.
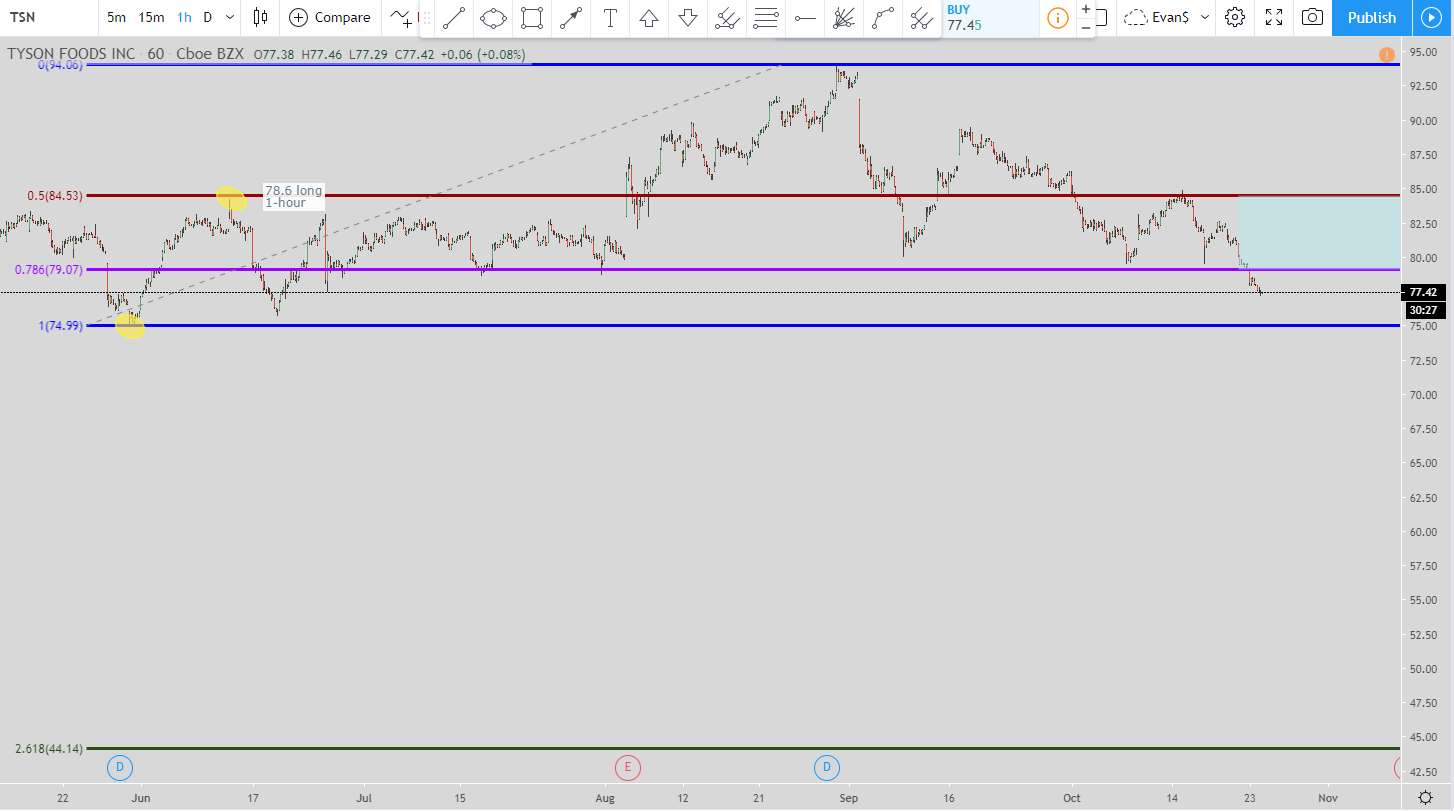
Finally, if that exit isn’t hit then the last entry would be way down at the green line which is the 261.8% Fibonacci extension area at $44.14. This would move the exit to the 100% blue line at $74.99.
If Tyson Foods stock continues to move lower without those exits getting hit then this would be a stock I would start to look at somewhere in the $60’s.
Prudential Financial (PRU)
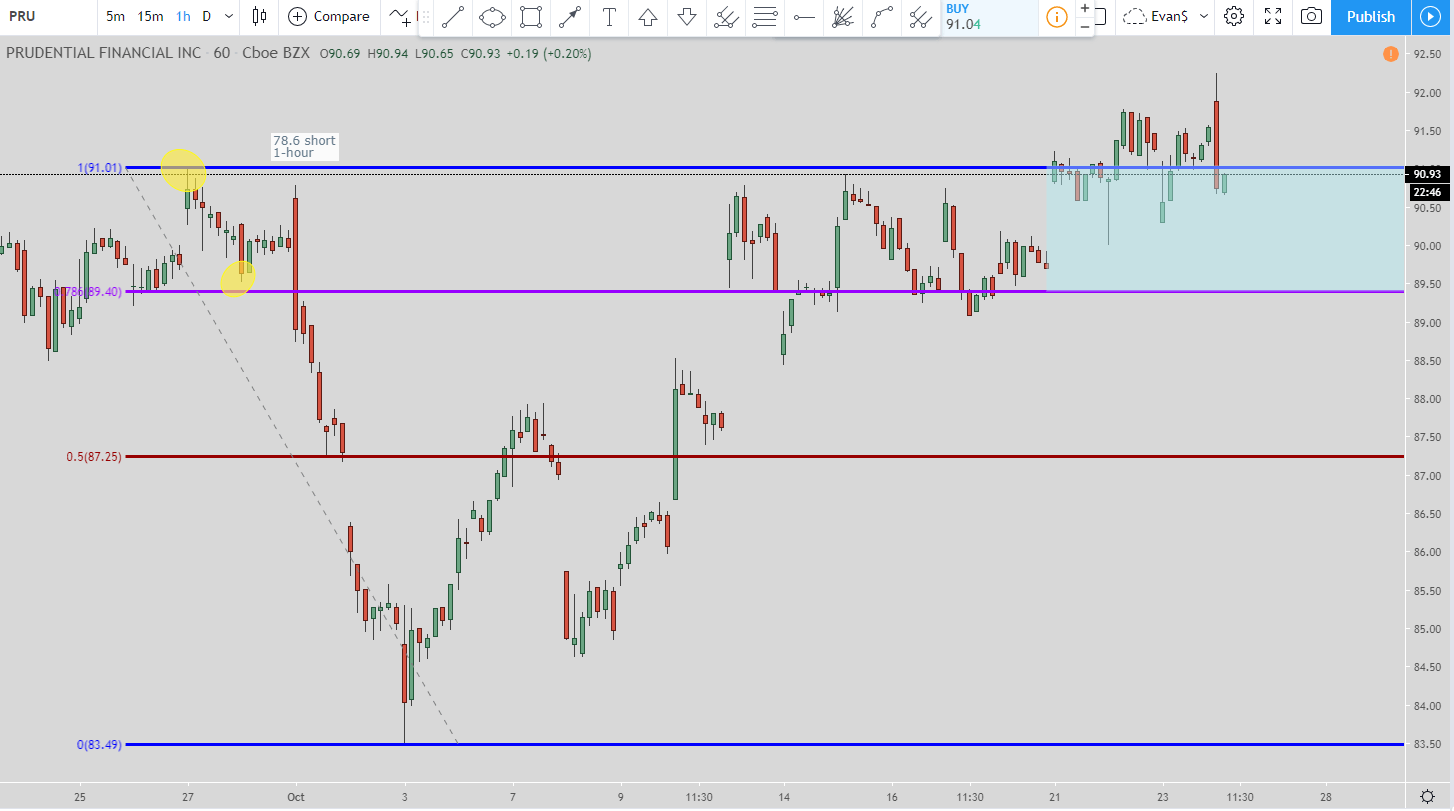
With the Prudential Financial stock it is currently in a 78.6% short setup. The setup was initiated when the price hit the 78.6% (the purple line) level at $89.40.
But as you can see price blew through it and then went and hit the 100% line (the blue line) at $91.01. That was the next entry level and that moved the exit to the 78.6% line at $89.40.
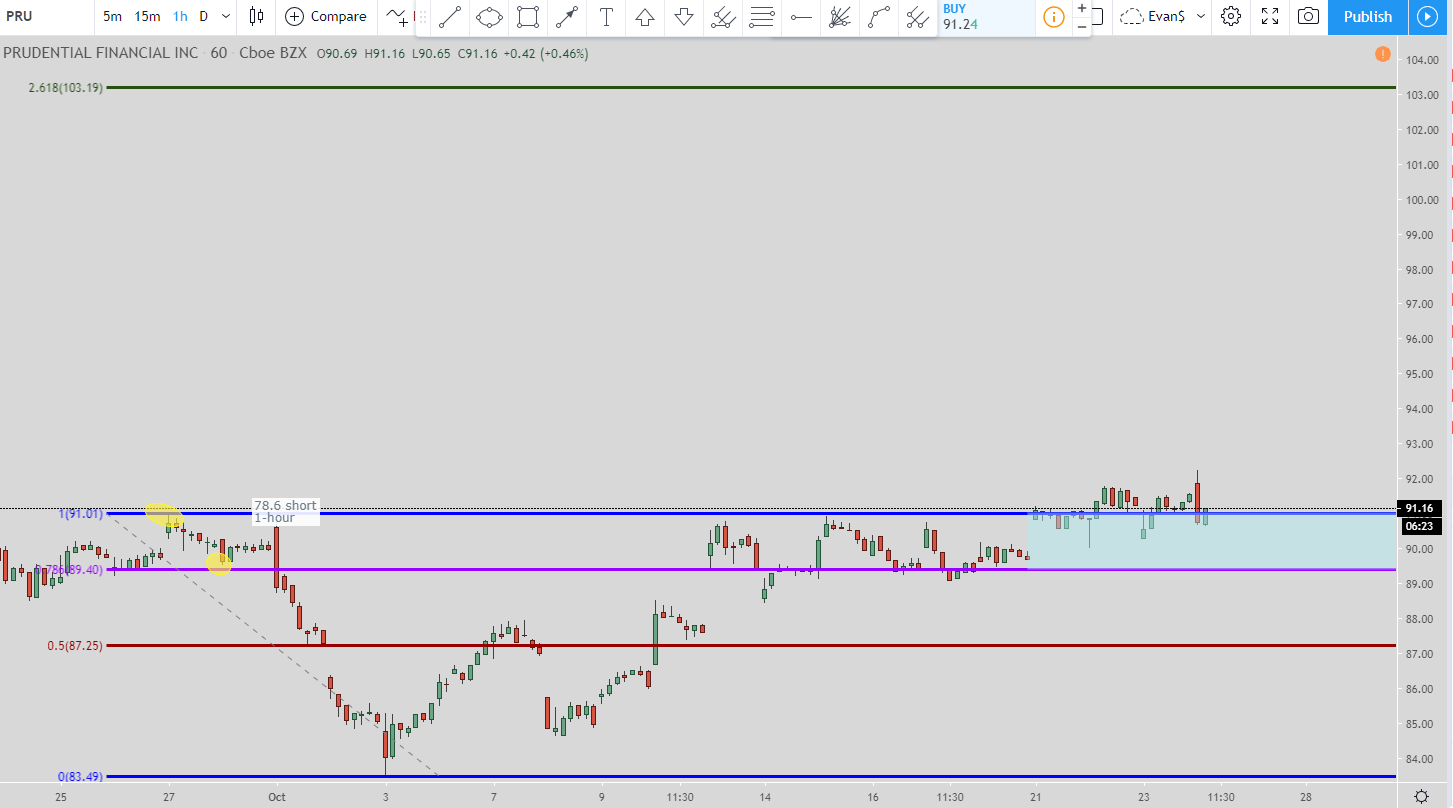
Lastly, if the price continues to move up and not hit the 78.6% exit then you would enter at the 261.8% Fibonacci extension level. This price is at $103.19. This would move the exit to the 100% level (the blue line) at around $91.01.
Principal Financial Group (PFG)
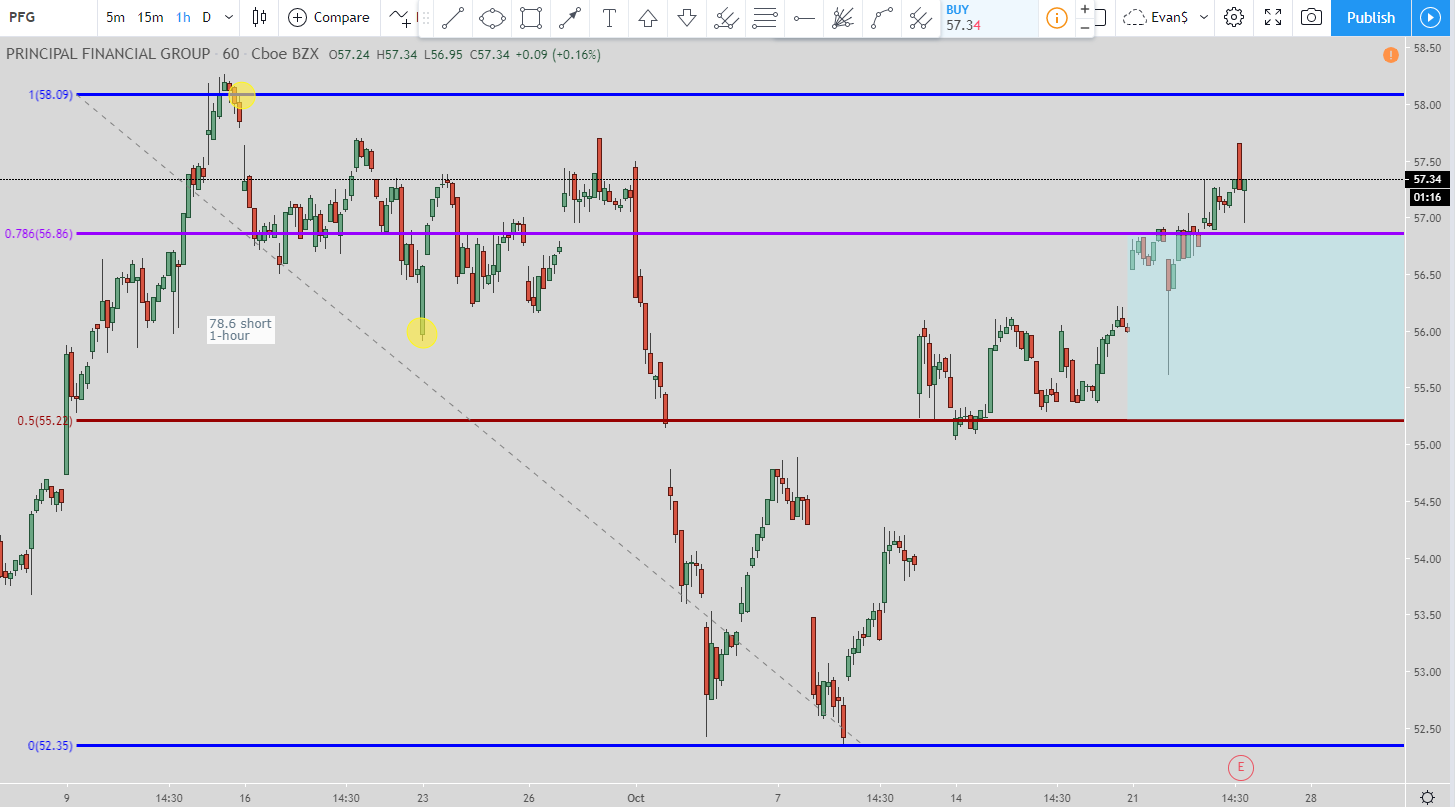
With the PFG stock it is currently in a 78.6% short setup using the 1-hour time frame for its chart. When the price hit the 78.6% line then that intitaited the short trade. The current exit is the 50% line at $55.22.
But if the price continues to move up without hitting the 50% exit and hits the 100% line at $58.09 then the exit will move to the 78.6% line at $56.86.
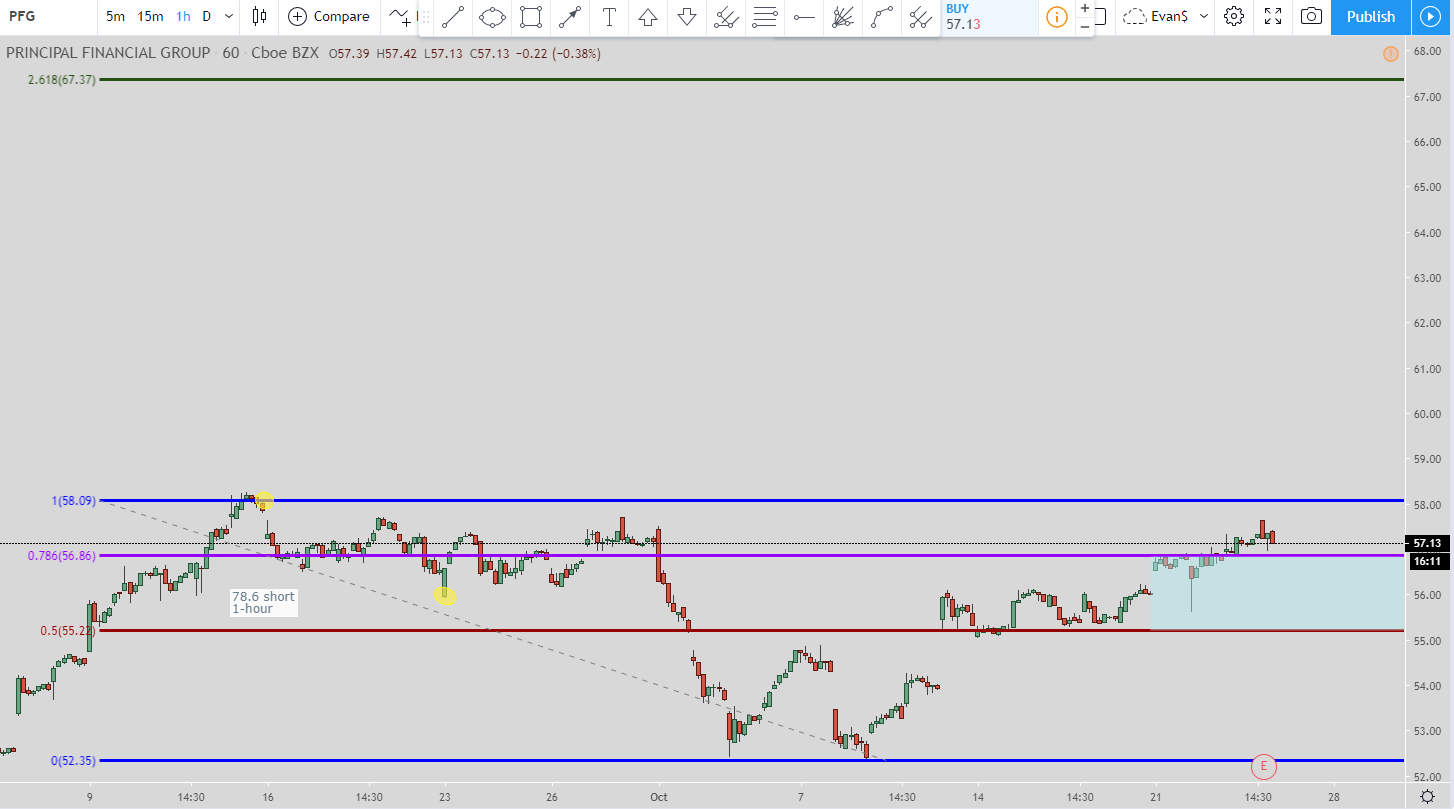
Finally, if one of those previously mentioned exits are not hit then the next entry will be the 261.8% Fibonacci extension level at $67.37. That is the green line at the very top. This will move the exit to the 100% line (the blue line) at $58.09.
Whew, there are all 10 stocks reviewed with each one having a setup with precise entries and exits as promised.
Video for the 10 Undervalued Stocks
Conclusion
So there you have my technical analysis for the 10 undervalued stocks based upon the Money Inc article.
How I came up with my technical analysis was through meditation. That was the key that turned my trading around from losing money to making money. I wrote an article that shows the exact process I use:
The best thing about meditation is that it is free! In the article I wrote I do recommend a book but you don’t have to purchase it. The book The Secret of Quantum Living (Amazon Affiliate Link) provides the fundamentals as to how I meditate. It is all about observing your thoughts/emotions and then letting them dissipate. Simple stuff.
I truly believe meditation can make a difference in your life. It will improve your trading but can improve your life overall as well.
Even if you don’ t think you have the time to do it then just do it for 1-minute per day. If you go over 1-minute per day then excellent!
But if that is all the time you can manage then so be it. What we are working on is developing your habits so that you will incorporate meditation into your daily routine.
Your habits determine how successful you will be in life so we want to make good habits so easy to do that you cannot help but do them each day.
As your good habits (such as meditation) become more ingrained into your daily routine then you can do them for longer and with more frequency. You won’t get that “bored” emotion or the push-back from your ego as to why you shouldn’t do it.
That is the key, start your habits small and make them too easy to do to fail. If you do more or go over your minimum time then awesome! But be consistent about it because it is better to meditate for 1-minute per day 7 days per week than for 10 minutes one day per week. Of course I hope you meditate for more than 1-minute eventually but 1-minute is better than 0 minutes.

