I studied Elliot Wave and spent many hours trying to apply it to my trading because I found it fascinating but I was never able to accurately predict where price would go. Only in hindsight was I able to do so. I like the structure it provided but projecting where price is going was tough for me and if I ever got my count off I was in trouble which happened often. Eventually I moved on from it but I have great respect for anyone who can make money trading the Elliot Wave theory.
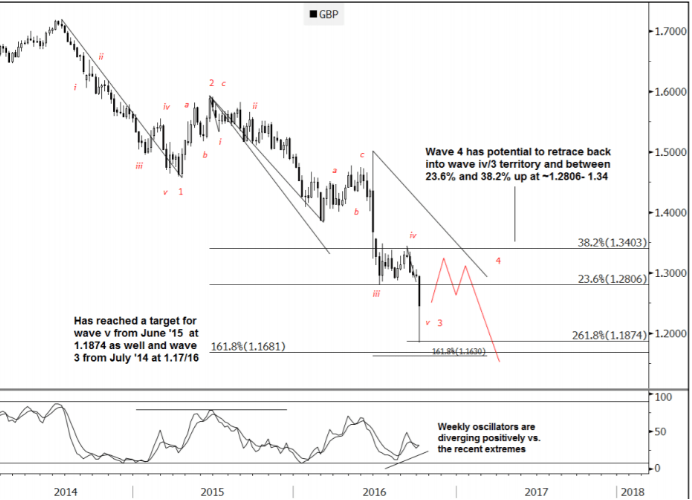
This is an interesting article that is saying very similar things as I am for the GBP: https://www.efxnews.com/story/34291/gbpusd-corrective-4th-wave-next-leg-lower-goldman-sachs. They use the Elliot Wave theory to explain where they project price moving and use the GBP/USD as an example.
Here is their chart:
I agree we are in a corrective (retracement) price movement which they are identifying as the 4th wave that is a retracment wave. They say there is still one more leg down to go after the 4th wave completes. I have no idea what price will do after the retracement, I just believe we are in a retracment until a certain price point is hit.
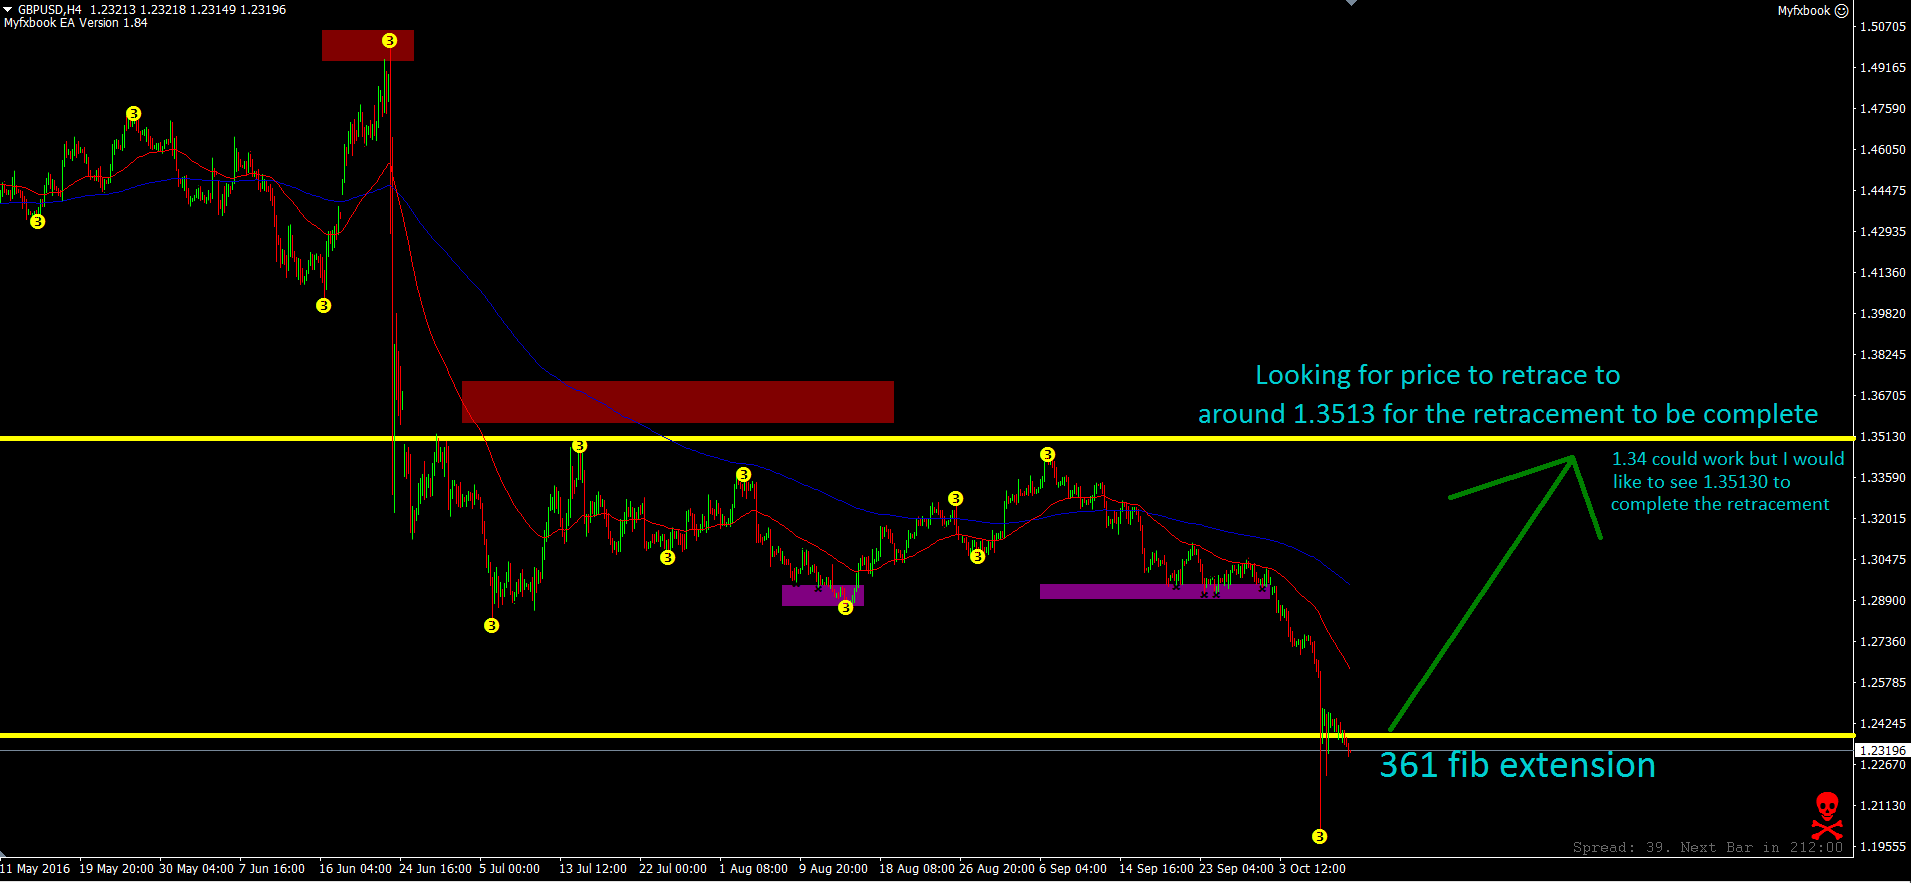
If price retraces to 1.34 (which is the extreme they think it will go during the retracement) then that would be close and I would consider calling the retracement complete but anything less than 1.34 would not work for me. I would rather see 1.35130 be hit for the retracement to be complete. If price does hit and/or go past that level then the GBP/USD could definitely go back down and create a new low which they would consider the 5th wave.
Here is my chart:
For the most part the author of that article and myself are in agreement that a retracement is underway. They predict a high point of 1.34 but I would like to see 1.35130. It’s very interesting because I do not use Elliot Wave at all but we each came to a very similar conclusion regarding the near term move for the GBP/USD.


