American Electric Power Company is a stock that has been going up since April 2009. This post will be about American Electric Power Company (AER): Will the Uptrend Continue? If you add in the fact that AEP also has a 3.01% dividend then this is one of the stocks where it did pay off to buy and hold. After reviewing the charts I must make a disclaimer that I have an order in to purchase an $80 put for January 2020 at $1.85. So far it has not been filled. I’ll explain what I am looking at in this post.
American Electric Power Company (AER): Will the Uptrend Continue? – Fundamentals
There are 7 fundamental markers I look for in a stock. I try to only purchase growth stocks so these are the parameters I look for to see if a stock meets the majority of the markers. I prefer to have all seven fulfilled. You can it more in depth here: https://evancarthey.com/how-to-scan-for-winning-stocks-an-insiders-view-to-my-process/
- Market Cap: > $300 million
- EPS growth past 5 years: >0%
- P/E: Over 10
- EPS growth next 5 years: >0%
- Sales growth past 5 years: Over 20%
- Debt/Equity: <0.1
- Sales growth qtr over qtr: Over 5%
Does the stock meet these 7 markers?
- Market Cap: 44.15B (YES)
- EPS growth past 5 years: 5.10% (YES)
- P/E: 21.64 (YES)
- EPS growth next 5 years: 5.79 (YES)
- Sales growth past 5 years: 1.80% (NO)
- Debt/Equity: 1.37 (NO)
- Sales growth qtr over qtr: 0.20% (NO)
I used Finviz.com for the fundamental analysis screener.
AEP from the growth markers I look for are not compatible with the stock being considered a growth stock. Obviously that has not stopped the stock since 2009 from going from the bottom left to the upper right of the stock chart. That is what you want if you are long a stock. Plus the divided would have made it an even better holding if you were or have been in it for the long term.
Technical Analysis
From the intro I mentioned I have a buy put order pending (it still hasn’t been filled and I am not chasing it). In the chart below I will explain why.

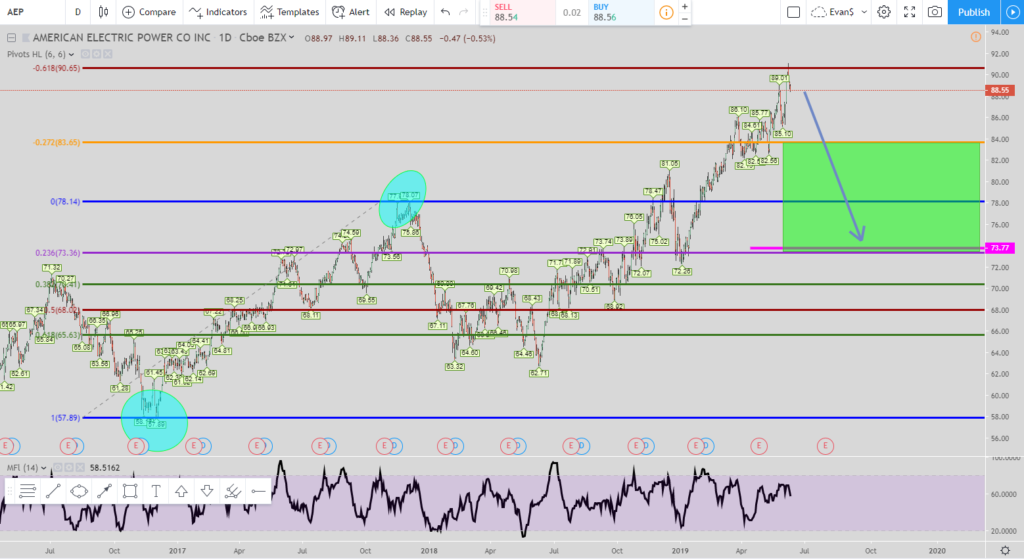
The setup being used here is my Springboard Short Setup. What it looks for is failed 127% Fibonacci extension levels. The final exit is the pink line at around $73.75. This move is very overextended and provides a great entry to get in now. Even if price continues to move up the exit won’t move. I’ll explain how the setup works below.

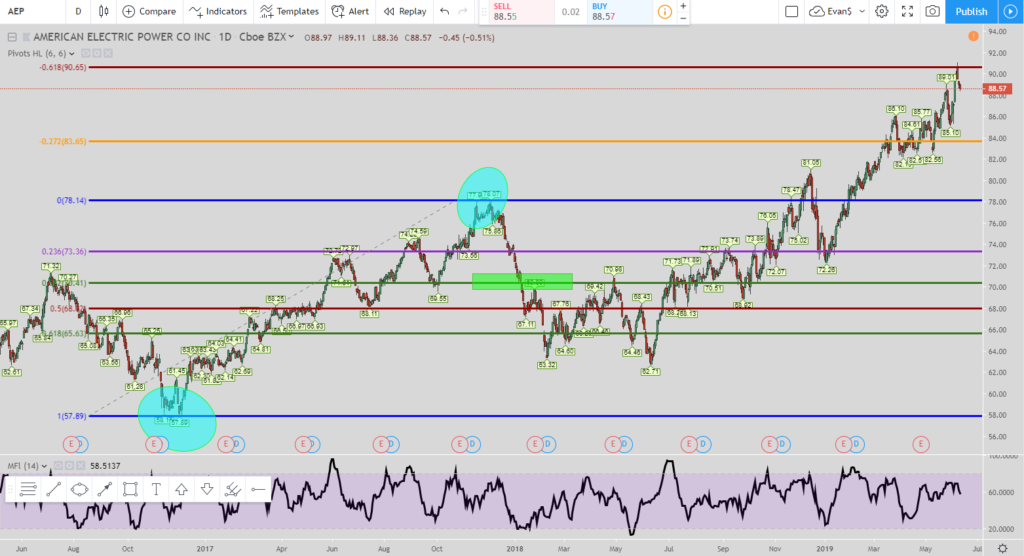
In the chart above I highlighted the 38% Fibonacci retracement line. The blue circles are the pivot points for the move. For the setup the move has to retrace back to the 38% Fibonacci line for the setup to be watched. So this gets it in my watch list for a potential short.

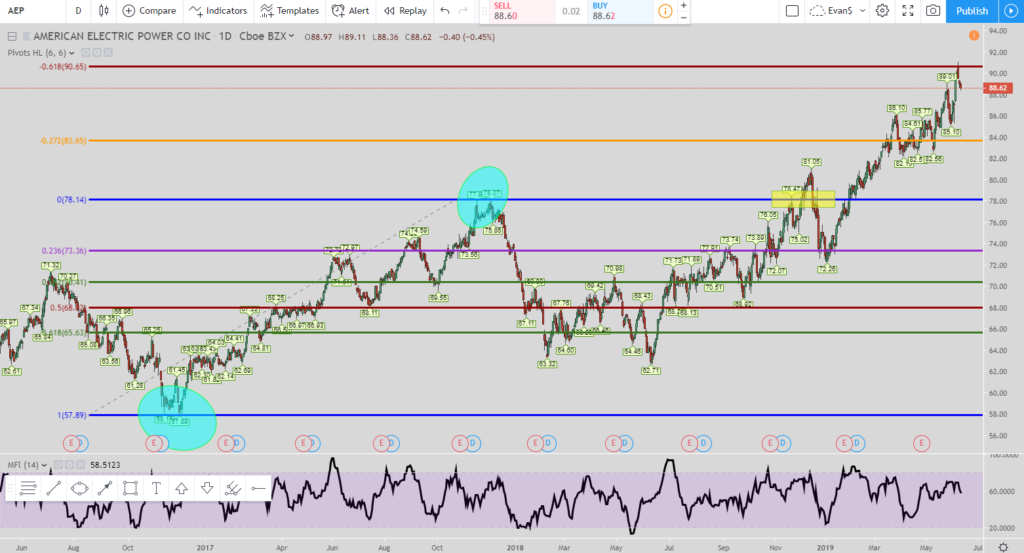
Next you wait for price to break the pivot point high (if looking for a short). The yellow highlight is where the price broke the pivot point high (the top teal circle). Next, if price doesn’t hit the 127% Fibonacci extension level (the orange line) then you might have a trade but there is one more item that has to be comleted first.
Price has to retrace back to the 23.6% Fibonacci line before hitting the 127% Fibonacci extension level. If price hits the 127% line 1st then it is not a valid setup and time to look for a new setup. But if price hits the 23.6% Fibonacci line which is the purple line then the trade has started. You can see in the image above where price broke out (the yellow box) it hit the 23.6% line before the 127% so the short trade has started.
Your 1st entry is the 23.6% Fibonacci level. Th exit is the 100% Fibonacci level. Obviously that never came close to happening.
Your next entry is the 0% Fibonacci level. You can see price retraced up to there. Once that happens then the exits move to the 38% Fibonacci level (the top green line). As you can see price never hit that either.
The price continued to climb and hit the 127% Fibonacci extension level. When that happened then the exits move to the 23.6% Fibonacci retracement level (the purple line). That is where the current exit is located and will not move up anymore even if price continues to rise. You can see how price did continue to rise and hit the 1.618% Fib extension level.
That is why I am trying to buy a put in order to short the stock. I feel the value of shorting the stock right now based upon the Springboard setup provides a very good reward.
Conclusion for American Electric Power Company (AER): Will the Uptrend Continue?
AEP has ignored the fundamentals and has been a great growth stock since 2009. Plus, it has a dividend so that has made it even sweeter if you have owned the stock. In the technical side I went over how I think it is in a short setup for the near to mid term. Once price hits around $73-$74 then we’ll have to wait and see if more growth is in store or is it going to be range bound for awhile.
Popular Links
Here are a couple of links if you are looking at how I view the market and some trade setups. You can create your own trading style and setups. Quit paying losing traders to teach you. The only thing they teach is how to lose money.
Robinhood Trading Broker Review
If this post benefits you and if you haven’t used Robinhood for trading stocks but are thinking to then please consider using my referral link when you do sign up: http://share.robinhood.com/evanc203.
This way each of us will receive a free share of a random stock if you sign up through my referral link.
My Robinhood Review: https://evancarthey.com/review-robinhood-trading-service-with-no-fees-part-1/


