Over the past year, Allergen can come off its highs of $197 and all the down to one point at $125. This post will be about how Allergan (AGN) Has Taken a Hit the Past Year? Time to Buy or Sell?
We will look at the 7 fundamental parameters I look to see if a stock can be considered a growth stock. Then we will take a look at the technical analysis side using the setups I have created and use for my trades. I have no plans to own Allegan in the next 72 hours and do not hold any positions in AGN.
Allergan (AGN) Has Taken a Hit the Past Year? Time to Buy or Sell? – Fundamentals
There are 7 fundamental markers I look for in a stock. I try to only purchase growth stocks so these are the parameters I look for to see if a stock meets the majority of the markers. I prefer to have all seven fulfilled. You can it more in depth here: https://evancarthey.com/how-to-scan-for-winning-stocks-an-insiders-view-to-my-process/
- Market Cap: > $300 million
- EPS growth past 5 years: >0%
- P/E: Over 10
- EPS growth next 5 years: >0%
- Sales growth past 5 years: Over 20%
- Debt/Equity: <0.1
- Sales growth qtr over qtr: Over 5%
Does the stock meet these 7 markers?
- Market Cap: 44.37B (YES)
- EPS growth past 5 years: -36.00 (NO)
- P/E: Not Available
- EPS growth next 5 years: 3.33% (YES)
- Sales growth past 5 years: 43.40% (YES)
- Debt/Equity: 0.38 (NO)
- Sales growth qtr over qtr: -2.00% (NO)
I used Finviz.com for the fundamental analysis screener.
There is a lot to unpack here. With Allergan (AGN) only hitting 3 of the 7 parameters then this is definitely not a growth stock. The P/E was not available either. The Debt/Equity isn’t bad at all at only 0.38 but it still doesn’t meet the threshold I am looking for at under 0.10. The sales growth over the past 5 years was really good at 43.40% but the rest of the sales metrics were not good.
Technical Analysis
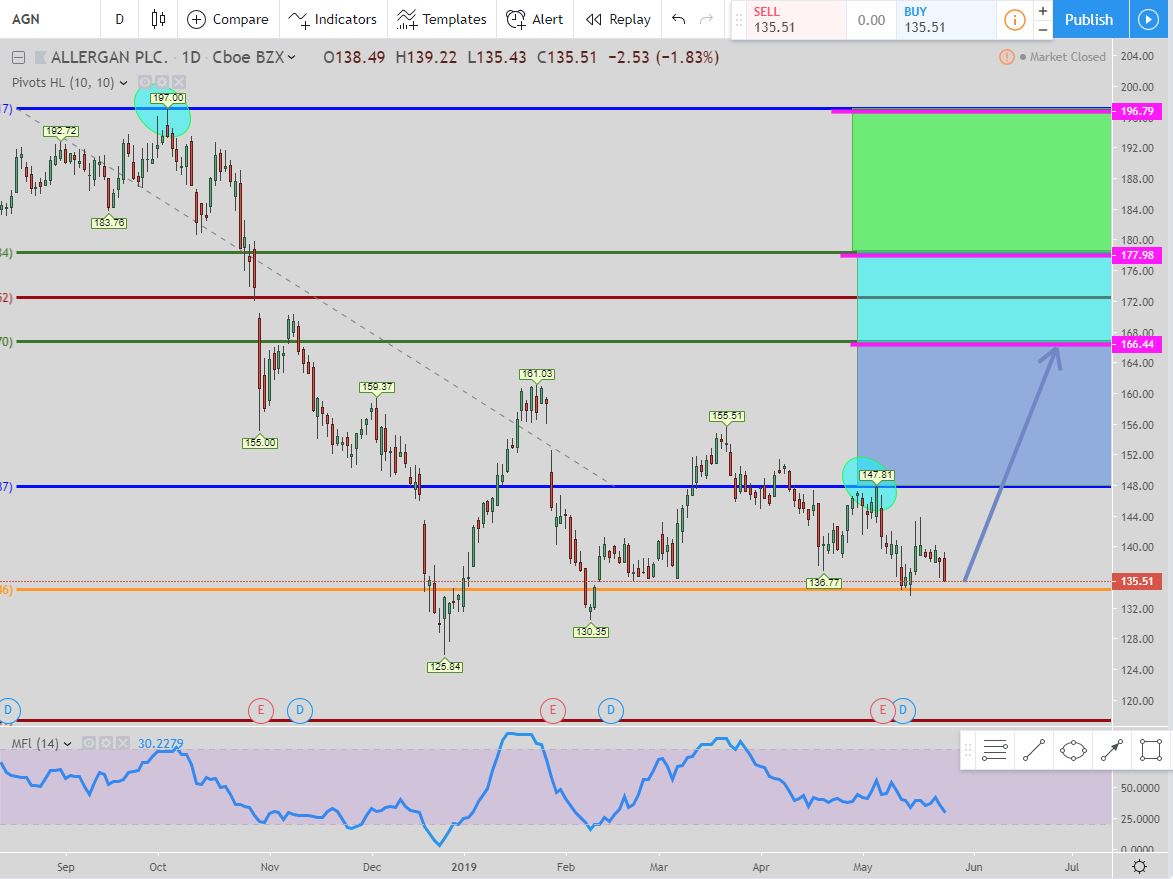
For Allergan (AGN) on the daily chart, we are waiting for the 61B short setup as the next trade. We are looking for price to move up to the pink line for the short to initialize. Once it does then the exit will be at the bottom of the blue box. But if the price doesn’t hit that exit and continues to move up to hit the 2nd pink line at $177.98 then the exits move to the bottom of the teal box. Finally, if the price hasn’t hit the exit and hits the top pink line at $196.79 then the exits move to the bottom of the green box at around $179.
If at anytime the price hits an exit then the move is over and you do not get in at any un-hit entries. The setup is done and time to look for a new trade. If the price continues to move up past the top pink line then you leave your exit at the bottom of the green box. It does not move again. You can, of course, continue to get in but that is the last exit level.
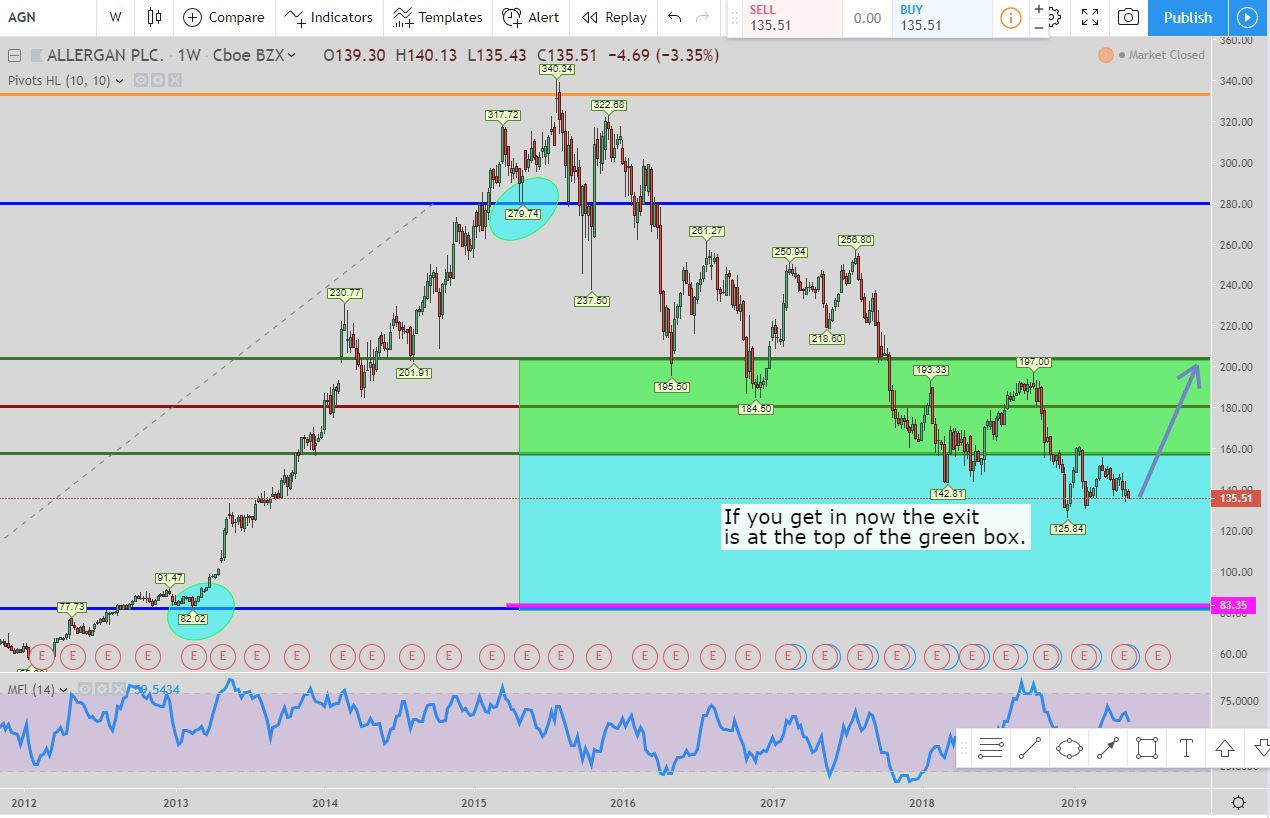
In this weekly chart, we are looking at the 61B long setup. You can get in now and this is what I consider a free trade. What I mean by that is your 1st entry is lower than the final exit. The final exit would be at the top of the teal box around $156. But that is only if the pink line at $83.35 hits. Right now the exit is at the top of the green box at around $203.
Conclusion of Allergan (AGN) Has Taken a Hit the Past Year? Time to Buy or Sell?
If you are looking for a buy and hold stock then, in my opinion, this isn’t one you would want to do that with based upon the fundamentals. There is currently a long setup on the weekly chart underway which is an interesting proposition. They do offer a dividend at a current percentage of 2.18% so if you are bullish on this stock and don’t mind your money being in there for a couple of years then this could be a good buy.
The main reason why is if you get in now at $135.51 then the lowest your exit would ever move to would be $155. Of course, if the company goes bankrupt then all bets are off. But assuming they are going to be around and somewhat profitable for years to come then there are much worse investments you could be in than in Allergan (AGN) in looking at it from a risk/reward perspective.
Popular Links
Here are a couple of links if you are looking at how I view the market and some trade setups. You can create your own trading style and setups. Quit paying losing traders to teach you. The only thing they teach is how to lose money.
Robinhood Trading Broker Review
If this post benefits you and if you haven’t used Robinhood for trading stocks but are thinking to then please consider using my referral link when you do sign up: http://share.robinhood.com/evanc203.
This way each of us will receive a free share of a random stock if you sign up through my referral link.
My Robinhood Review: https://evancarthey.com/review-robinhood-trading-service-with-no-fees-part-1/
